The fact is, the proponent’s current “Alternative 1A” proposal would be much more dangerous as the fast and turbulent water exiting the proposed generating station would be 250′ closer to the in-water recreational area at the base of the north falls.
And there would be two aspects of this which would make this water even more dangerous:
- Faster water.
- The speed of the jet of water exiting the propsed station would depend on how much water would be going through the station.
- The proponent would run as much water through their proposed generating station as they could, so more flow available from Lake Muskoka would result in more water through the station (up to its capacity).
- Analysing the historical flow data for the Moon River shows that the water flow available is quite variable, but the summary is that, depending on the year, the station would have been run at its maximum capacity every month of the year, even during many days of July and August – an average of 21 days each summer – when one normally thinks of there being low flow. Rain can happen at any time, and this would result in the plant running at full capacity.
- When the proposed station’s operation would be cycled.
- As people would get a false sense of safety when the station was stopped, even though the remotely-controlled station could – and would – start at any time, since it all depends on the weather.
- Analysing the last 44 years of water flow data shows that on average, the proposed station would have used the dangerous cycling operation for more than ⅓ of all summer days (from May 1 to Labour Day).
In summary, the dangerous flow from the proposed station would not just be during spring runoff, or only for a few days every summer. During the summer months, the variable and treacherously turbulent water would occur often enough that it would always be a “clear and present danger” that could and would happen at any time, because:
- The station would be remotely-controlled with nobody present (video cameras would only be as good as the lighting and weather conditions – and the remote operator’s attentiveness – permit), not good enough for safeguarding life given how many people will be both up- and down-stream of this location, day and night, and in all seasons of the year.
- It all depends on the weather, so there would not be any way for those nearby to know when the water would be safe.
Below is the analysis of the Moon River flow, both for when the station would be operated at full capacity, and when its operation would be cycled, as both would increase the danger to the public just trying to enjoy themselves in the water, as people have been at the base of the north falls for over 100 years.
Detail – Running at Full Capacity
The proponent reported that the water velocity shown in the image below was for a flow through their proposed station of 98 m³/s – its maximum capacity.
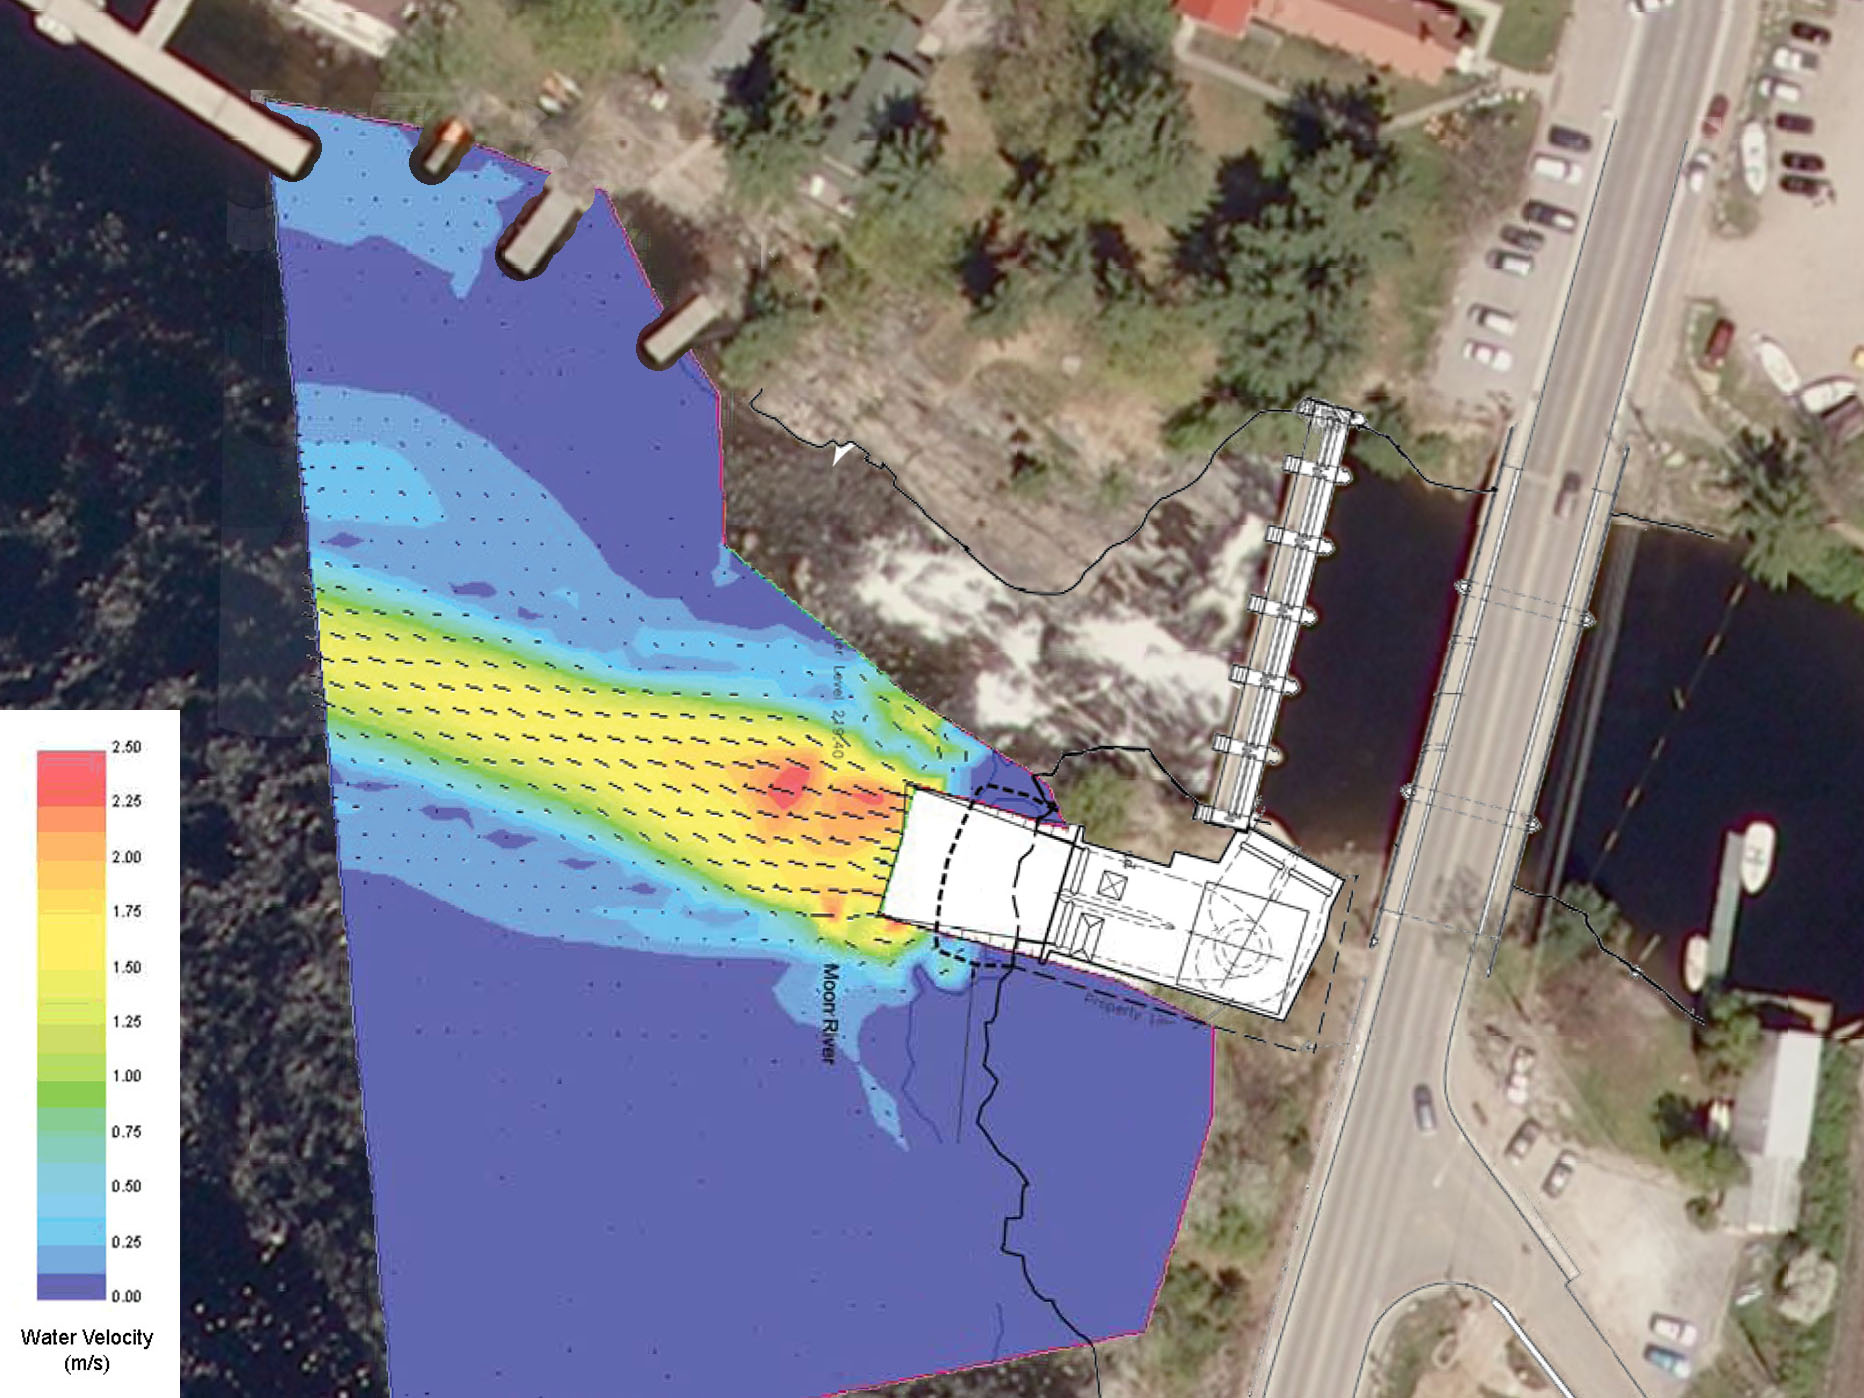
So a good question is; how often and at what times of the year would the water flow at such a high rate.
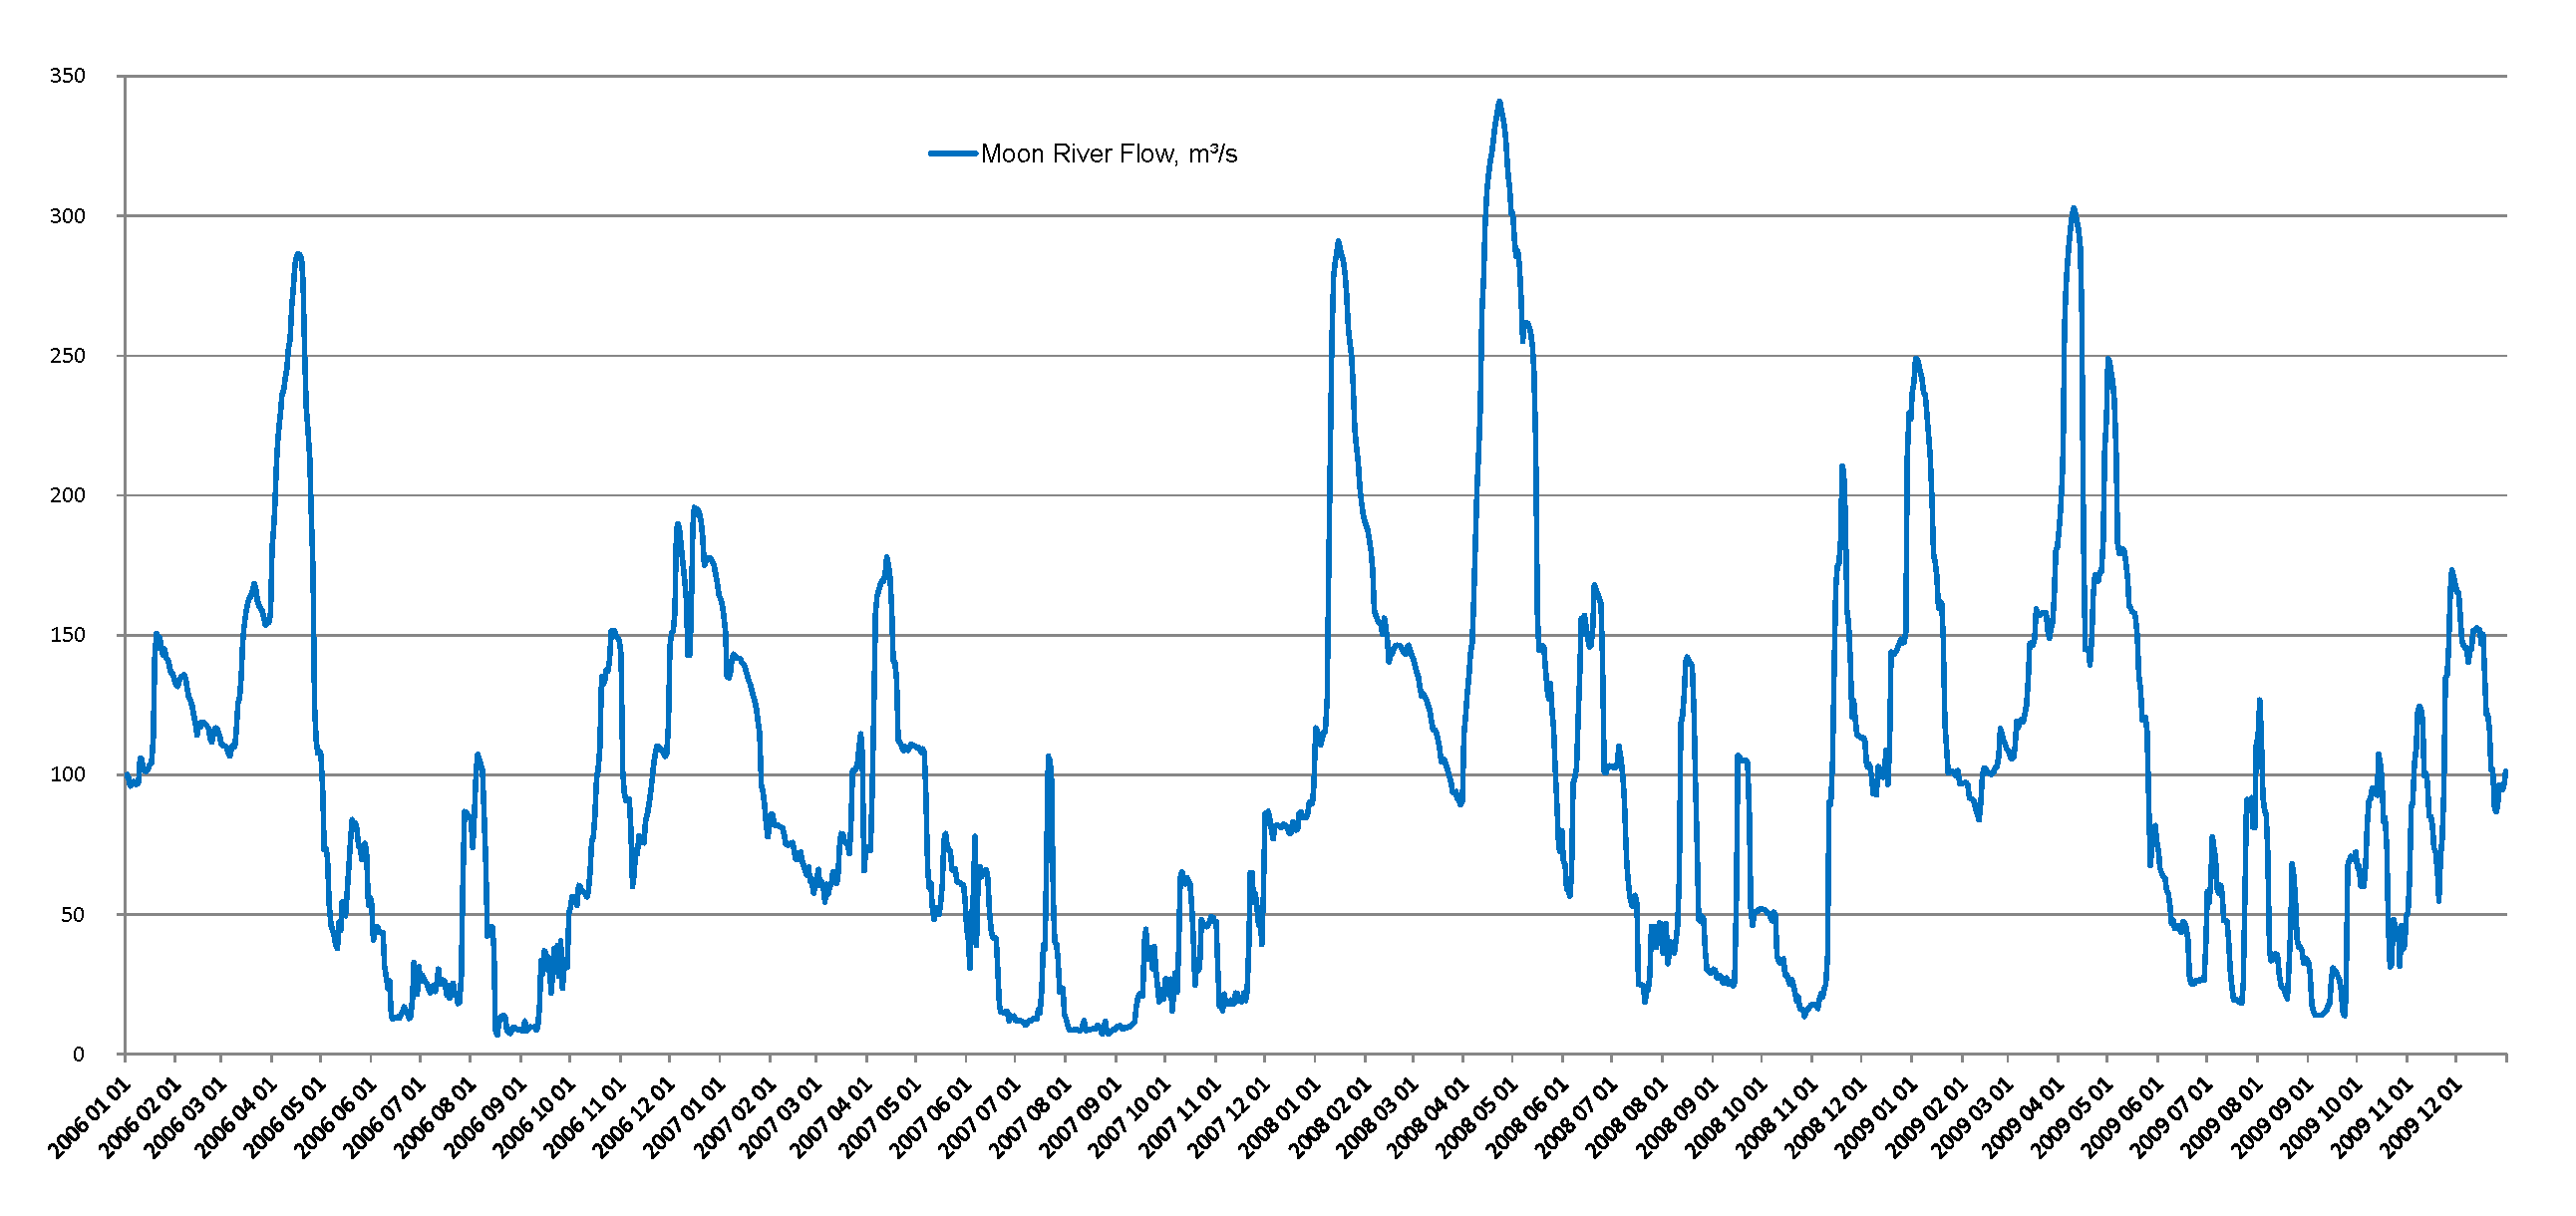
River flow data is available from Environment Canada, and for the Moon River, data is currently available from 1965 through 2009. This data can be graphed. For example, the graph below shows the day-by-day flow in the Moon River for the four years 2006 through 2009. The vertical axis units are cubic metres per second (m³/s), some examples of these units are that:
- Both Ontario Power Generation’s Ragged Rapids generating station and the proposed station at Bala would have a maximum capacity of about 95 m³/s.
- The Burgess Creek generating station has a capacity of 4 m³/s.
- The proponent is proposing that the remaining flow over the Bala north and south falls would be 1 m³/s each, for most of the year.
The graph below shows the Moon River flow ranges from a minimum of as little as 10 m³/s each August to early September, to a maximum each spring (click on the graph for a higher-resolution view). As shown in the graph, the spring peak flow is typically 250 to 300 m³/s, but both the timing and the peak flow varies. For example, the peak flow during these four years was 340 m³/s on April 23, 2008. In fact, in 2008 there were two peaks, with a peak of 290 m³/s very early, on January 15, 2008. And in 2009 there were three or four peaks, with an early peak of 250 m³/s on January 4, 2009 and a late peak also of 250 m³/s on May 1, 2009 – these in addition to perhaps the “expected” spring peak which was on April 10, 2009 of 303 m³/s.
To better understand how the differing Moon River flows would affect public safety, some analysis is needed.
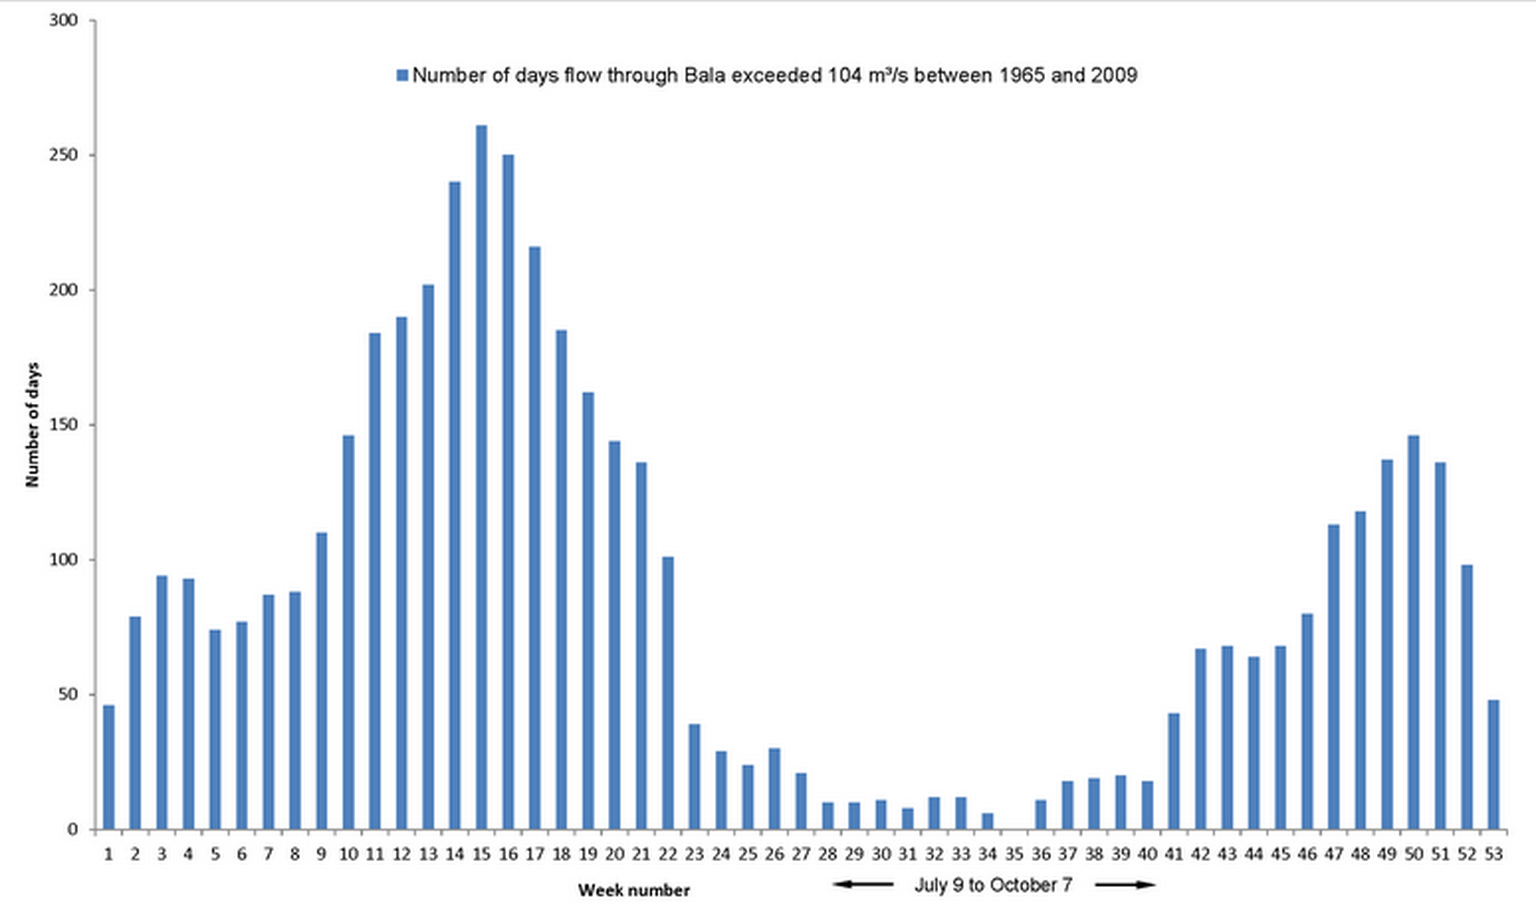
For example, for a flow of 98 m³/s through the proposed generating station, the total flow down the Moon River would be 104 m³/s (since there would also be a piddly 1 m³/s of flow over each of the Bala north and south falls and 4 m³/s of flow through the Burgess generating station on the Mill Stream). The histogram below shows that the proposed generating station would most often run at full capacity in the spring, as one would expect. But the histogram below also shows that in the 44 years of data available, the proposed station would have operated at full capacity at least 10 times during most every week of the summer as well. That it, the treacherously dangerous water from the proposed generating station could and would flow just metres from the in-water recreational area at the base of the north falls at any time of the year, even during the summer.
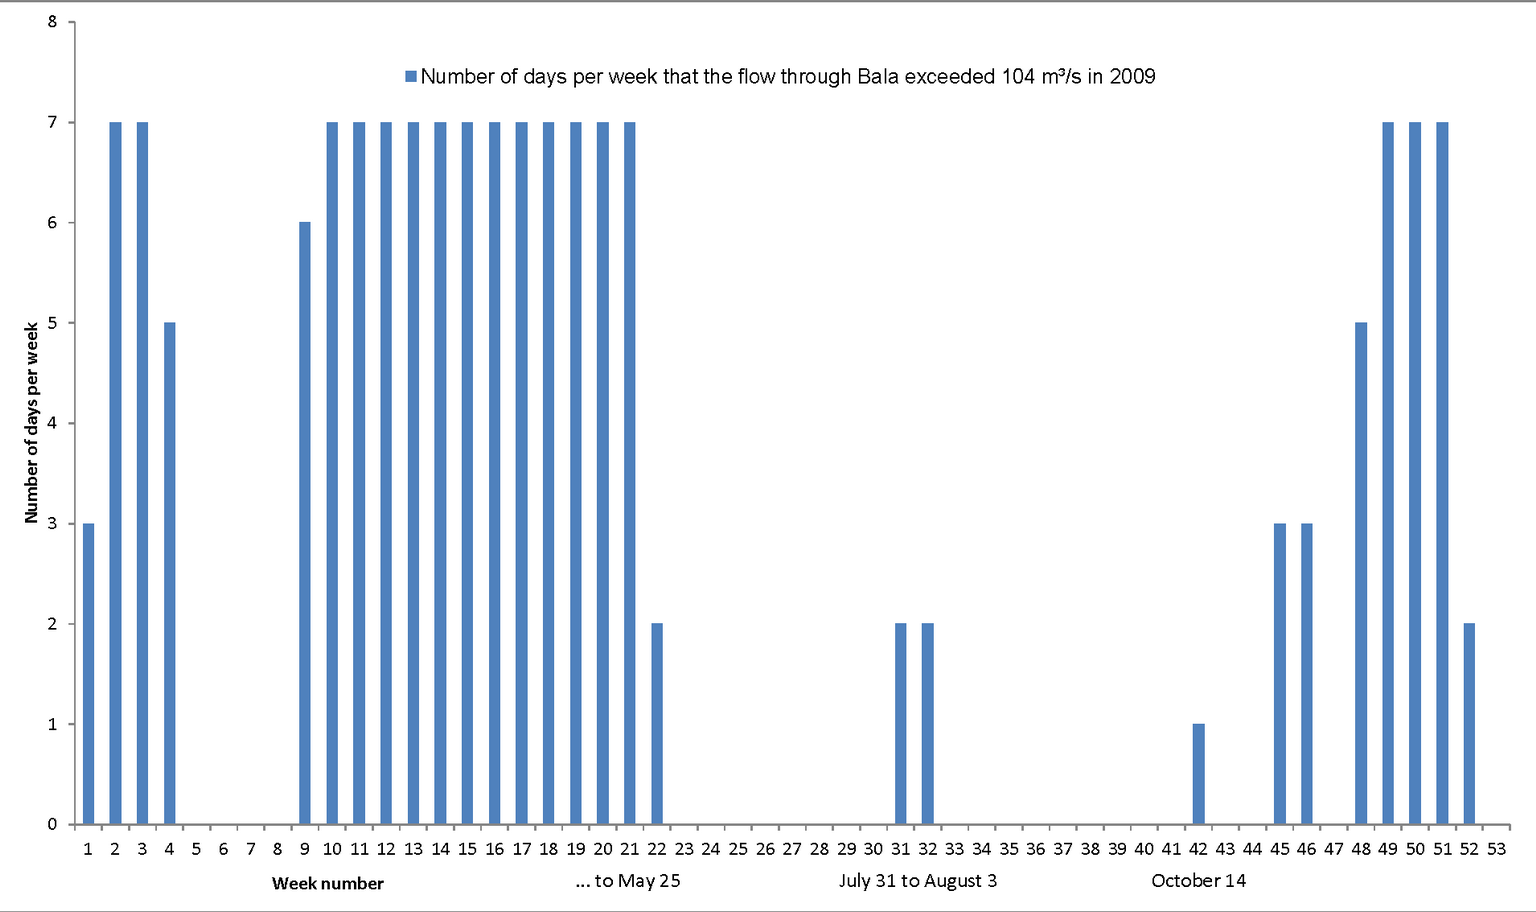
Let’s look at some particular years – below are histograms for each of the most recent three years for which complete data is available. The histograms show how many times of each week of the year the proposed generating station would have been operating at full capacity, producing a jet of fast and turbulent water just metres away from the base of the north falls.
The histogram below is for 2009 and shows the station would have been running at full capacity:
- Until May 25.
- For the four days, from July 31 to August 3.
- On October 14.
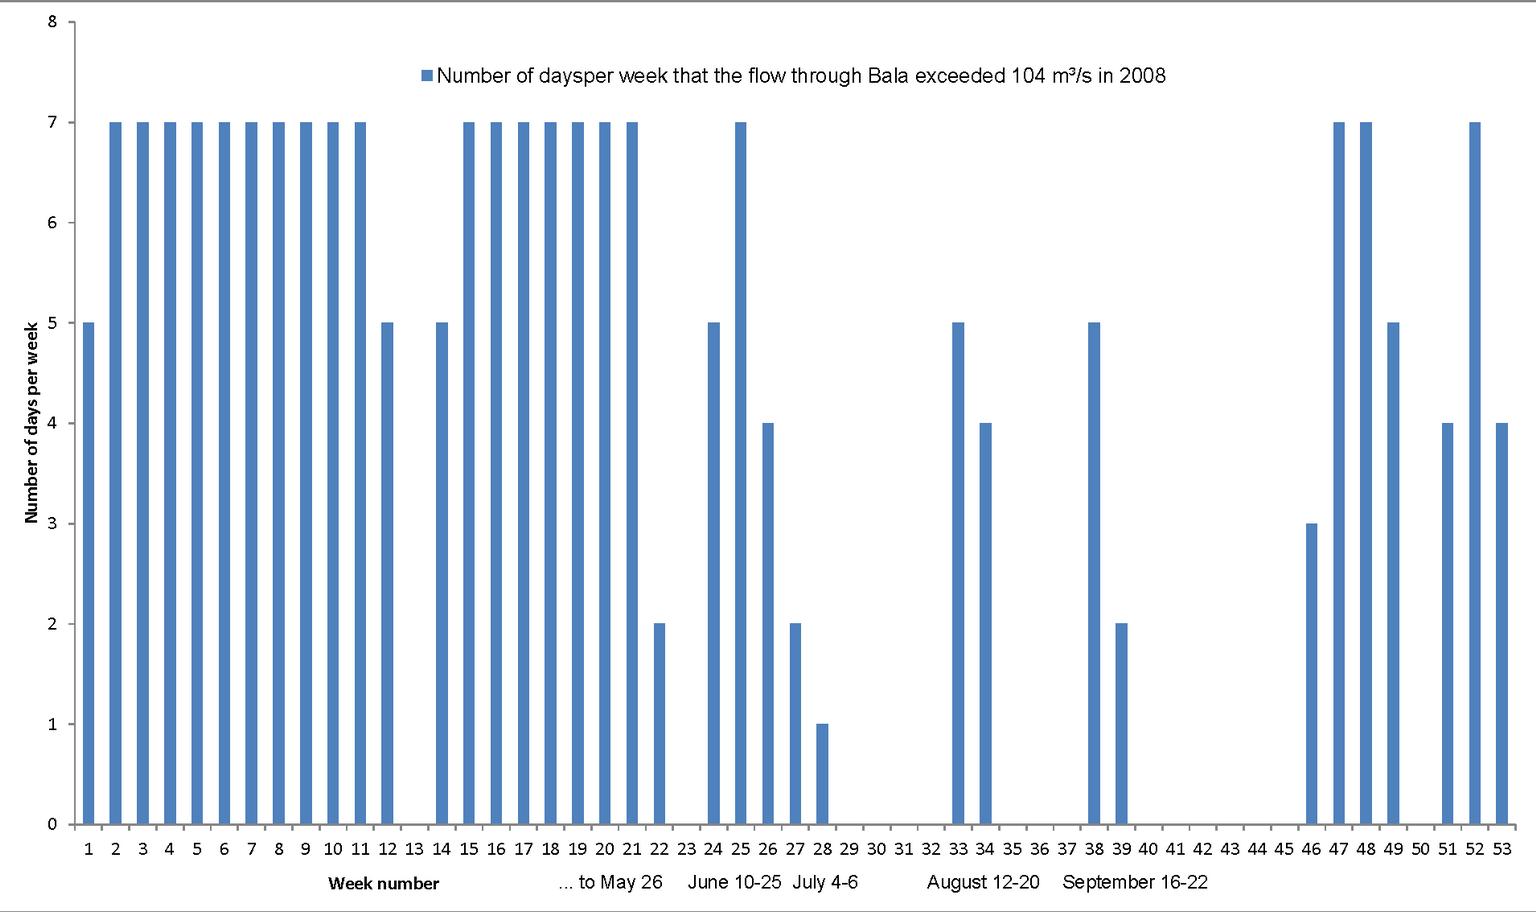
For 2008, as shown below, the proposed station would have run at full capacity:
- To May 26.
- From June 10 to June 25, and again from July 4 to 6.
- From August 12 to 20.
- From September 16 to 22.
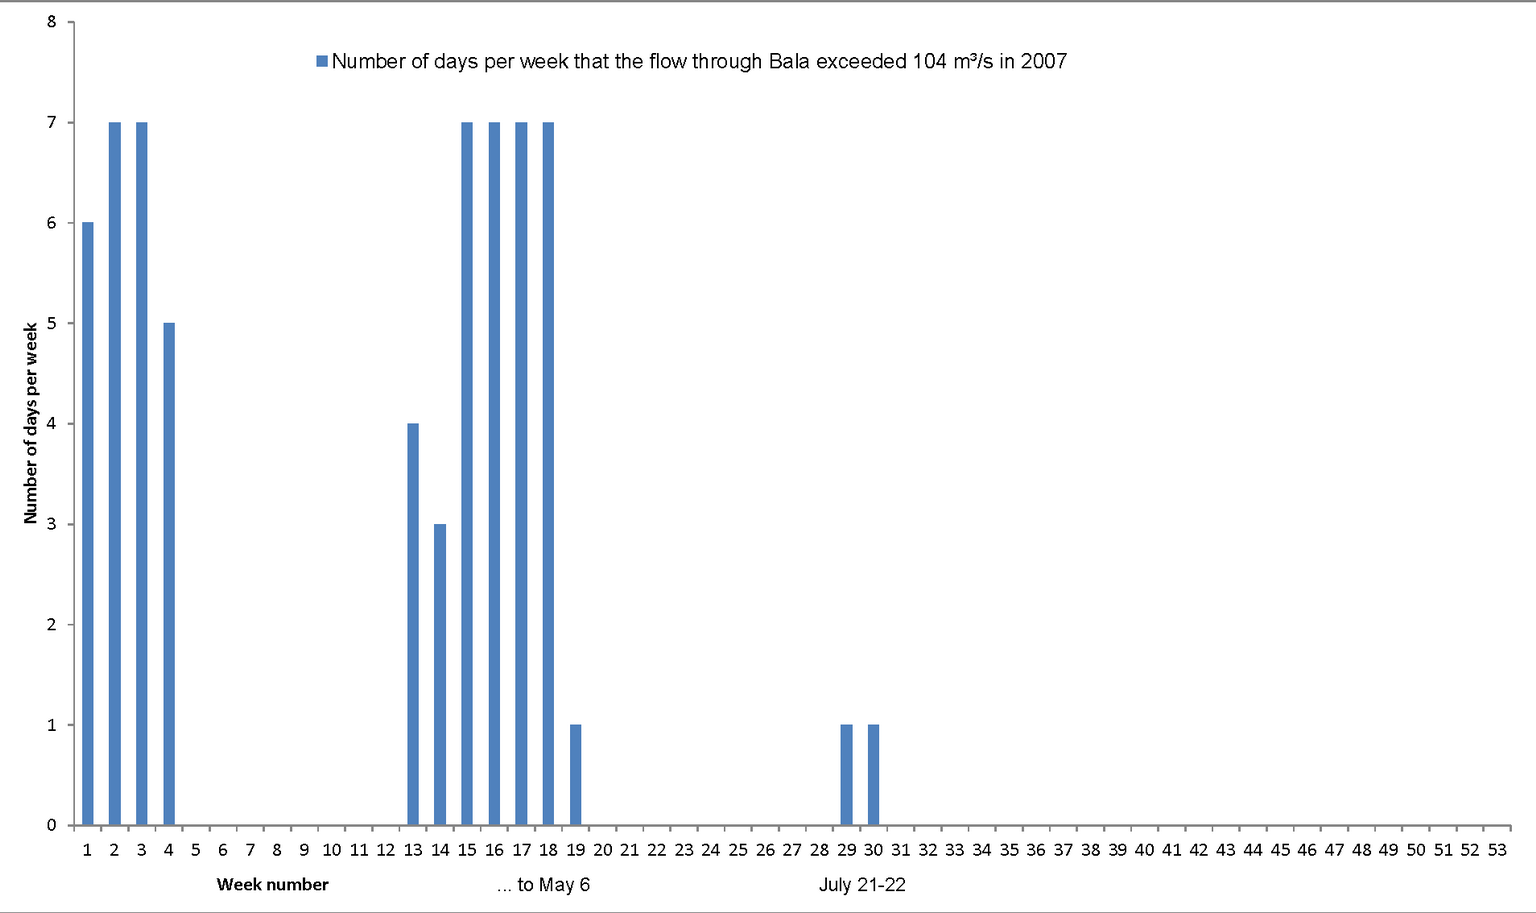
Finally, for 2007, the station would have run at full capacity:
- To May 6.
- From July 21 to 22.
So, the point is, the station would be running at full capacity many times during the in-water recreation times of the year, we just wouldn’t know when or for how long.
Detail – Cycling Operation
But that’s not all, it gets worse. During the summer, the proposed station would frequently begin the day stopped and quiet, resulting in people ignoring any warning signs and playing in the water at the base of the north falls, as people have for over 100 years. But due to the proposed station’s cycling operation, for about ⅓ of summer days, it would begin operating at about noon.
The Ontario Power Generation station at Ragged Rapids downstream on the Musquash River needs a flow of at least 26 m³/s to operate, and when there would be less than this (which occurs mostly in the summer), they would require the proposed generating station at Bala to cycle off until there is enough water built-up in Lake Muskoka so they can allow through at least 26 m³/s to run the Ragged Rapids station. This flow would likely begin at about noon each day, as that is when the peak demand for power occurs. So people may be playing at the base of the north falls, when the proposed – and remotely-operated – generating station would begin operation each summer day. So the question is, how often would such cycling operation begin during the period from May 1 to Labour Day, as that is when it is most likely people would be in the water nearby.
Firstly, the histogram below shows how many times per week the flow in the Moon River has been below 26 m³/s between 1965 and 2009. As expected, this is mostly during the later summer, but it ranged from early April to mid-December. Some statistics are:
- During these 44 years, cycling would have been required an average of 75 times per year, with 61% of the cycling days during the peak in-water recreation time from May 1 to Labour Day.
- Cycling would have occured 2,029 times out of the 5,683 days between May 1 and Labour Day, so on average, cycling would have been required for 36% of these summer days, which would have been 46 days each summer (this may be reduced slightly, as cycling operation in May might not be started if the Walleye have not yet had their two weeks to spawn).
![]()
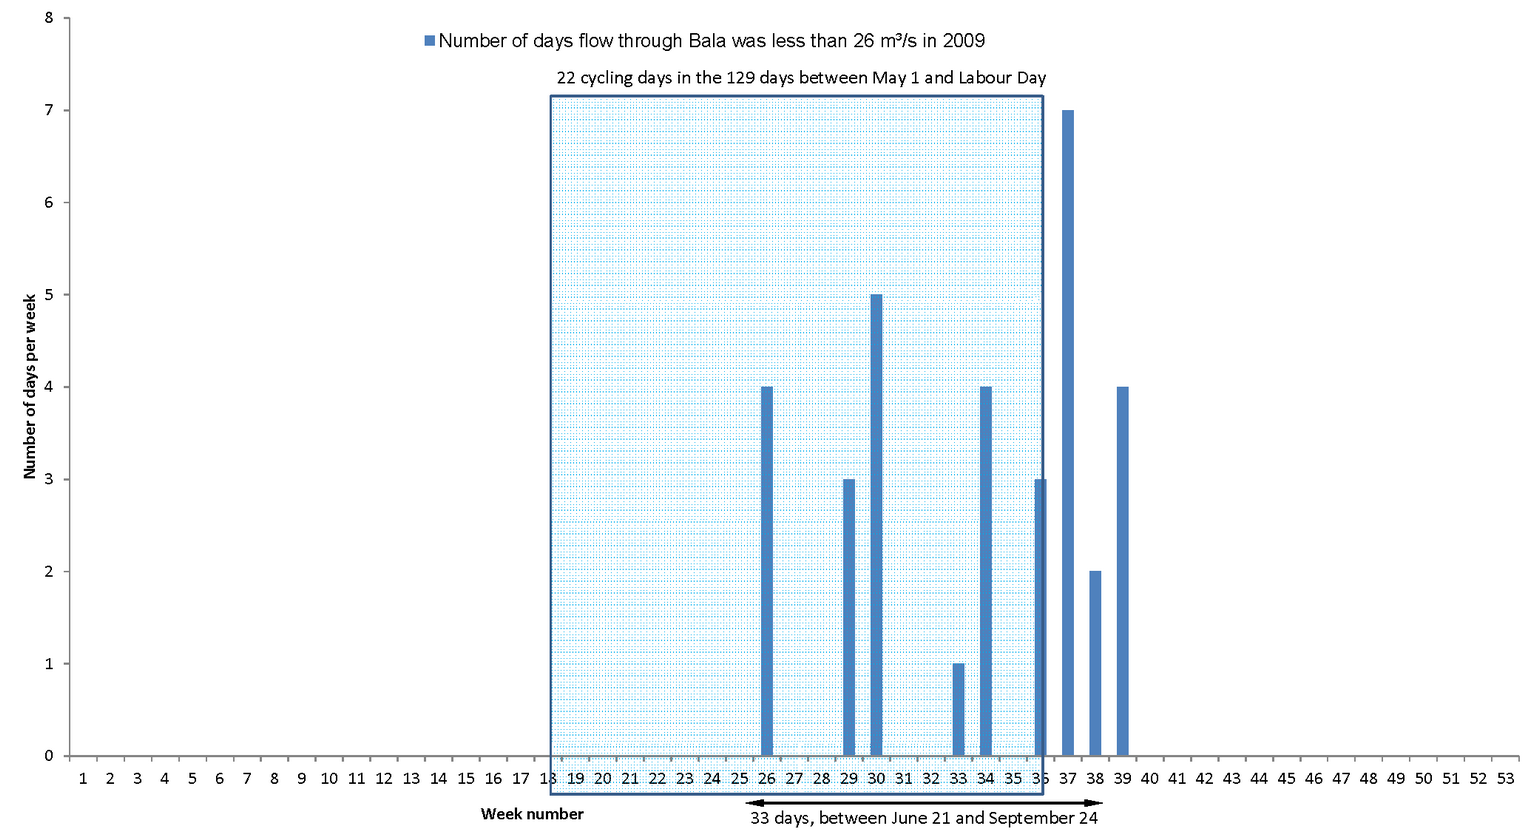
Looking at recent years in particular, the histogram below shows that for 2009, the proposed station would have operated in cycling mode on 33 days, between June 21 and September 24, and there would have been 22 days between May 1 and Labour Day with cycling operation, which would be 17% of summer days.
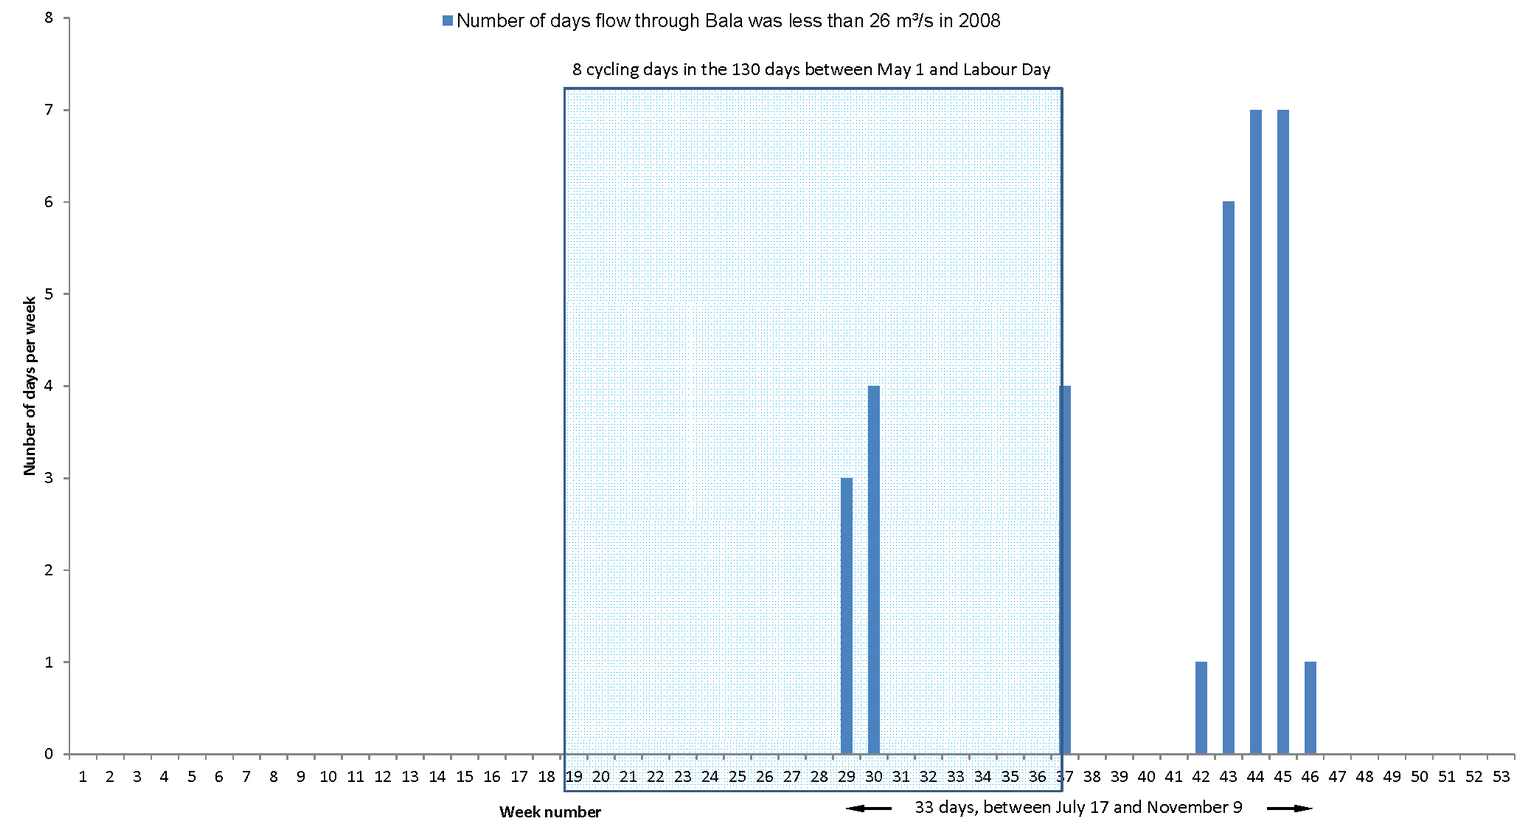
For 2008, as shown below, cycling mode would again have been needed on 33 days in total, but only 8 of these days would have been between May 1 and Labour Day.
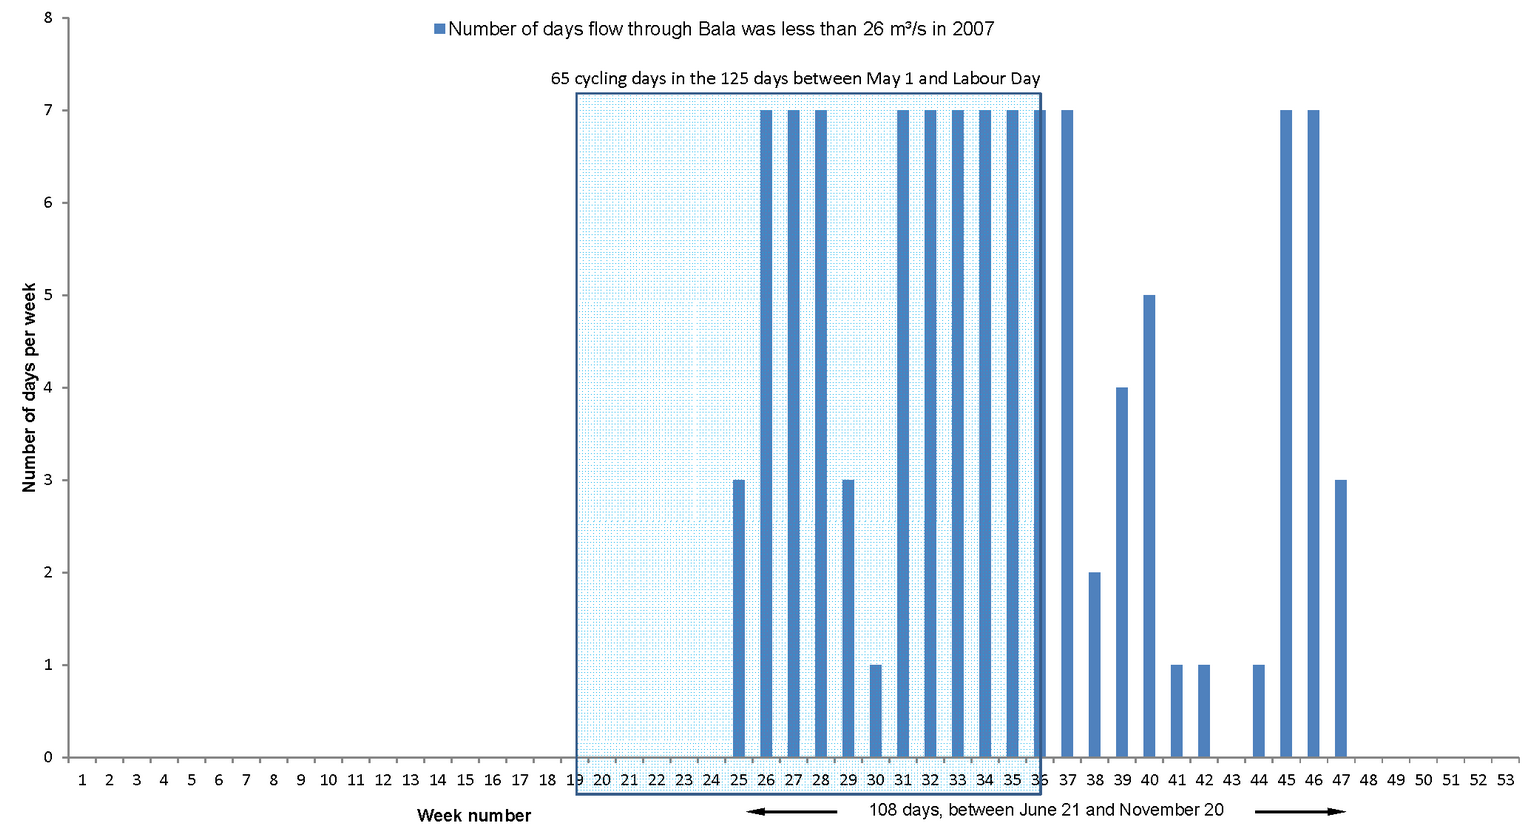
For 2007, cycling mode would have been needed on 108 days, spanning June 21 to November 20, and there would have been 65 days between May 1 and Labour Day with cycling operation. That is, there would have been cycling operation on more than half of the days between May 1 and Labour Day.
It only takes ONE cycling to kill by drowning in a sudden release or unexpected flow increase to drown a person. That is one too many!
It is illegal to swim below a HEP station so what is going on!!!!!!
People or Power – build solar – doesn’t hurt or kill anyone. I hope the proponents and government have good insurance/lawyers.